Sidebar
pipeline:window:cryolo:visualize
The most recent version of this page is a draft. This version (2020/03/12 16:58) is a draft.
Approvals: 0/1The Previously approved version (2019/09/14 10:18) is available.
 This version (2020/03/12 16:58) is a draft.
Approvals: 0/1The Previously approved version (2019/09/14 10:18) is available.

This is an old revision of the document!
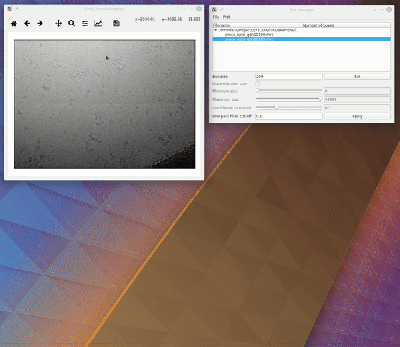
To visualize your results you can use the box manager:
cryolo_boxmanager.py
Now press File → Open image folder and the select the full_data directory. The first image should pop up. Then you import the box files with File → Import box files and select in the boxfiles folder the EMAN directory (or EMAN_HELIX_SEGMENTED in case of filaments).
The following does not yet work for filaments.
CrYOLO writes cbox files in a separate CBOX folder. You can import these into the box manager which enables a slider in the GUI that allows you to change the confidence threshold and see the results in a live preview. You can then write the new box selection into a new box file.
pipeline/window/cryolo/visualize.1584028694.txt.gz · Last modified: 2020/03/12 16:58 by twagner
Page Tools
Except where otherwise noted, content on this wiki is licensed under the following license: GNU Free Documentation License 1.3


