Sidebar
 This version (2020/03/12 17:04) is a draft.
Approvals: 0/1The Previously approved version (2019/09/14 10:18) is available.

This is an old revision of the document!
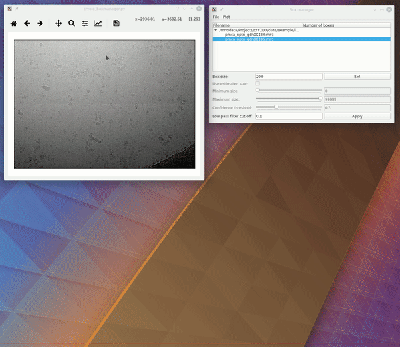
To visualize your results you can use the box manager:
cryolo_boxmanager.py
Now press File → Open image folder and the select the full_data directory. The first image should pop up. Then you import the box files with File → Import box files and select in the boxfiles folder the EMAN directory (or EMAN_HELIX_SEGMENTED in case of filaments).
CrYOLO writes cbox files in a separate CBOX folder. Those files contains besides the particles more information like the confidence and the estimated size of each particle. When importing .cbox files into the box manager, it enables more filtering options in the GUI. You can plot size- and confidence distributions. Moreover, you can change the confidence threshold, minimum and maximum size and see the results in a live preview. If you are done with the filtering, you can then write the new box selection into new box files. The video below shows an example.


