sp_bfactor_plot
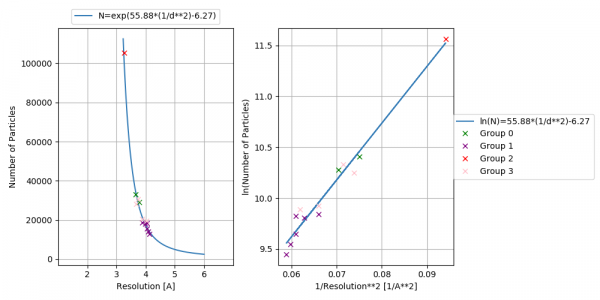
Plot B-factor : Plots number of particles versus resolution.
Usage
Usage in command line:
sp_bfactor_plot.py search_directory output_directory --mode=mode --groups=groups --flo=flo --display=display_exe --verbosity=verbosity --sharpendir=sharpendir --selectpattern=selectpattern --resfile=resfile --apix=apix
Typical usage
The purpose of sp_bfactor_plot.py is to:
: plot the number of particles versus resolution
1. Standard usage: create separate stacks for each class:
sp_bfactor_plot.py search_directory output_directory --mode=2d_or_3d --groups=number_of_groups
If number of groups is not specified, all classes will have the same color. If groups of classes are found, then they can be colored differently.
2. 2D: Gets number of particles from params_avg* files and resolution from beautifier directories:
sp_bfactor_plot.py search_directory output_directory --mode=2d --groups=number_of_groups
Specifically, program will look for a beautifier file called 'FH_list.txt' to get the resolution, and parameter files called 'params_avg*' to get the number of particles. If your files have other names, see the advanced parameters below. (The development version of the beautifier stores all information in 'FH_list.txt', and doesn't use an unrealistically optimistic resolution estimate.)
3. 3D: Gets number of particles from Meridien directories and resolution from PostRefiner directories:
sp_bfactor_plot.py search_directory output_directory --mode=3d --groups=number_of_groups
Program will look for a PostRefiner file called 'log.txt' to get the resolutions, and a parameter file called 'final_params*' to get the number of particles. If your files have other names, see the advanced parameters below. Program will also attempt to fit points.
Input
Main Parameters
- search_directory
- Directory where input files fill be searched
- output_directory
- Directory where outputs will be written. (default required string)
- --groups
- Number of groups to plot. (default 1)
- --flo
- Lowest resolution on plot, Angstroms. (default 7)
- --apix
- pixel size (needed in 2d mode for old-style 3-column 'FH_list.txt' files). (default 'final_params*' or 'params_avg*')
Advanced Parameters
- --sharpendir
- Subdirectory to look for PostRefiner resolution file. (default None)
- --selectpattern
- Alignment-parameter file template, enclosed in quotes. (default None)
- --resfile
- Resolution file. (default 'FH_list.txt' for 2d or 'log.txt' for 3d)
Output
- bfactor.png
- Plot of Number of particles versus resolution
Description
Method
Reference
Optimal determination of particle orientation, absolute hand, and contrast loss in single-particle electron cryomicroscopy.
Rosenthal PB, Henderson R. J Mol Biol. 2003 Oct 31;333(4):721-45. doi: 10.1016/j.jmb.2003.07.013.
Developer Notes
Author / Maintainer
Tapu Shaikh & Sabrina Pospich
Keywords
Category 1:: APPLICATIONS
Files
sphire/bin/sp_bfactor_plot.py
See also
Maturity
Beta:: Under evaluation and testing. Please let us know if there are any bugs.
Bugs
Automatic display of plots does not always work (file system not refreshed yet?).

