sp_gui_cter
CTF Assessment: GUI tool to assess and sort micrographs according to their CTF parameters estimated by sp_cter.
Usage
Usage in command line
sp_gui_cter.py cter_ctf_file
Typical usage
Standard usage: sp_gui_cter can be run as a stand-alone program or run from the SPHIRE GUI:
sp_gui_cter.py CTER_DIR/partres.txt
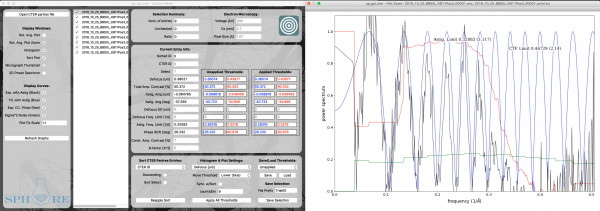
Upon startup, the following windows will appear:
- Control Panel
- Main window controlling display of the other windows, and displaying data from partres.txt
- Rotational Average Plot, Zoomed
- 1D profiles of the power spectra, experimental and calculated. Unzoomed version can be displayed (see below). Ordinate (vertical) range can be set in the main Control Panel window, under Plot Fix Scale.
- Histogram
- Plot of number of micrographs as a function of a selected parameter (see below)
- Sort Plot
- Plot of a selected parameter (see below) for each micrograph
The following windows are not displayed by default, to minimize the number of pop-up windows, and can be displayed by clicking on the corresponding checkbox from the Control Panel window, under Display Windows at the top left.
- Rotational Average Plot
- Unzoomed version of the plot above
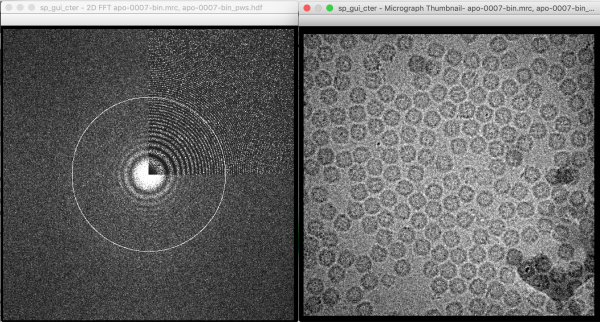
- Micrograph Thumbnail
- Downsampled (512×512) micrograph
- 2D Power Spectrum
- Periodogram of micrograph, with one quarter replaced by the theoretical form. Circle is drawn at the astigmatism resolution limit.
sp_gui_cter can also be used to visualize CTFFIND output.
sp_gui_cter.py CTFFIND_DIR/partres.txt --ctffind
TranSPHIRE generates compatible partres files. Note, however, that TranSPHIRE does not currently write 2D power spectra to a single directory, nor does CTFFIND write micrograph thumbnails. If you wish to visualize these outputs, move them to respective subdirectories, and specify them:
If these files are not present, the program will simply display a warning, and you can continue.
The parameter that will be plotted on the Histogram and Sort Plot is selected under Histogram & Plot Settings. The default parameter is defocus. Micrographs in the Sort Plot and micrograph list are initially sorted by micrograph number (or the order in which they appear in the partres file, i.e., CTER ID). By clicking Sync w/Sort, the micrographs will be sorted from low to high defocus. Micrographs in the Sort Plot and micrograph list can be sorted by the parameter selected under the pulldown menu Sort CTER Partres Entries.
Outliers in the parameter selected in Histogram & Plot Settings can be removed in three ways:
- 1. Histogram or Sort Plot
- Thresholds can be dragged on the Histogram or Sort Plot. The lower limit is displayed as a blue dotted line, and the upper limit in red. Clicking on either plot will set the lower limit to this value. To set the upper limit, go to the pulldown menu Move Threshold, and select Upper (red).
- 2. Edit Unapplied Thresholds
- In the table of parameters labeled Unapplied Thresholds, edit the value for the selected parameter. Initially, only the limit selected under the Move Threshold pulldown menu will be editable. To edit both the lower and upper limit, select Edit only under the Move Threshold pulldown.
- 3. Load Thresholds file
- Load previously set thresholds, if available, by clicking Load and selecting the threshold text file of the form Trial00_thresholds.txt. To see how to create such a file, see below.
In addition to defocus value, another potentially useful metric to sort is Astigmatism Frequency Limit. This number tells us to what resolution CTER was able to fit the experimental power spectrum, when taking astigmatism into account. Micrographs with a poor resolution limit may not be useful for obtaining a high-resolution reconstruction.
To apply these thresholds, click on Apply All Thresholds in the Control Panel. A pop-up dialog box will appear, asking you confirm whether to apply the thresholds. The deselected files will no longer be checked in the micrograph list, and the Selection Summary at the top of the Control Panel will be updated with the current number of total and deselected micrographs.
Clicking on Save Selection will write out the following files:
- Trial00_micrographs_ select.txt
- List of selected micrographs
- Trial00_micrographs_ discard.txt
- List of selected micrographs
- Trial00_partres_ select.txt
- CTF parameters of the selected micrographs
- Trial00_partres_ discard.txt
- CTF parameters of the deselected micrographs
- Trial00_thresholds.txt
- Applied thresholds for each parameter
The default prefix for output files can be changed from Trial00 by changing the value in the field File Suffix. (Note: should be Prefix)
Input
Main Parameters
- cter_ctf_file
- File containing CTF parameters: This file is produced by sp_cter and normally called partres.txt. (default none)
Advanced Parameters
Output
Description
Method
Reference
Developer Notes
2017/12/07 Toshio Moriya
The format of partres.txt is changed. The old format is also supported for now, but will be removed in near future. Please also refer sp_cter.
Author / Maintainer
Toshio Moriya
Keywords
Category 1:: APPLICATIONS
Files
sparx/bin/sp_gui_cter.py
See also
Maturity
Beta:: Under evaluation and testing. Please let us know if there are any bugs.
Bugs
There are no known bugs so far.


